
2023
Data Visualization Management Dashboard of Energy Industry C
Entrant Company
CHN ENERGY DIGITAL INTELLIGENCE TECHNOLOGY DEVELOPMENT (BEIJING) CO., LTD
Category
Strategic Program - Brand Strategy Campaign
Client's Name
Country / Region
China
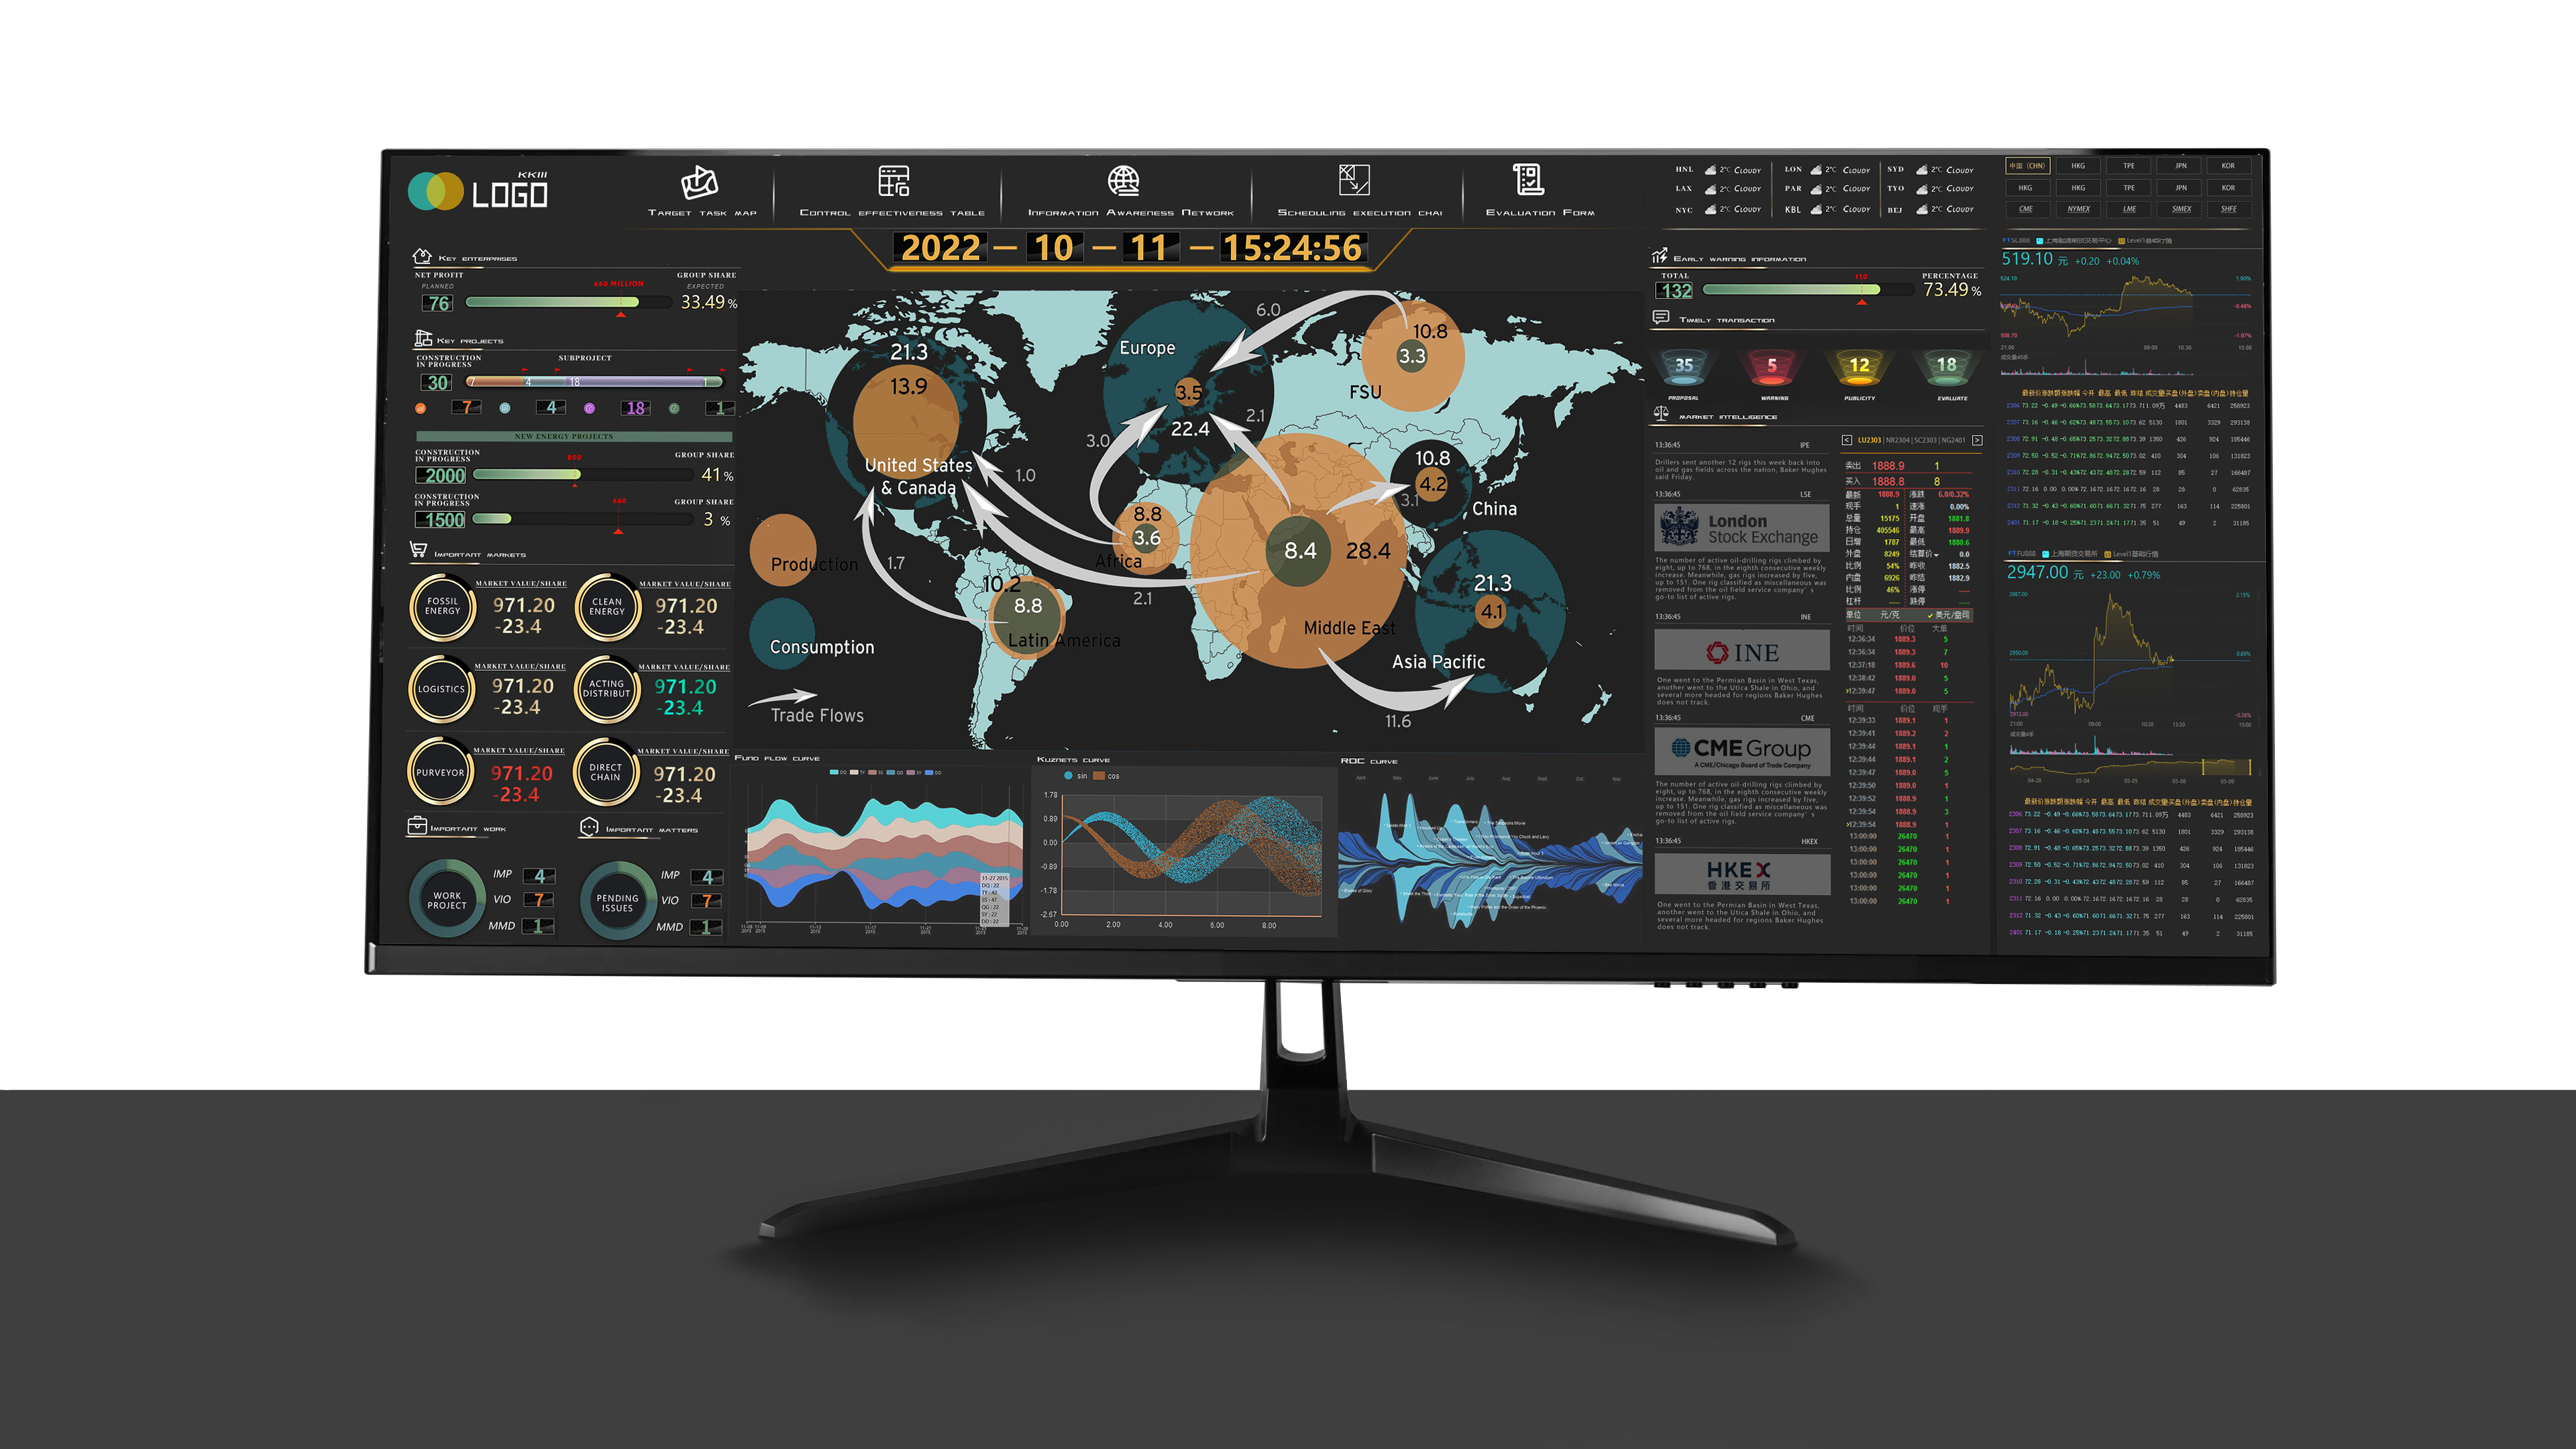
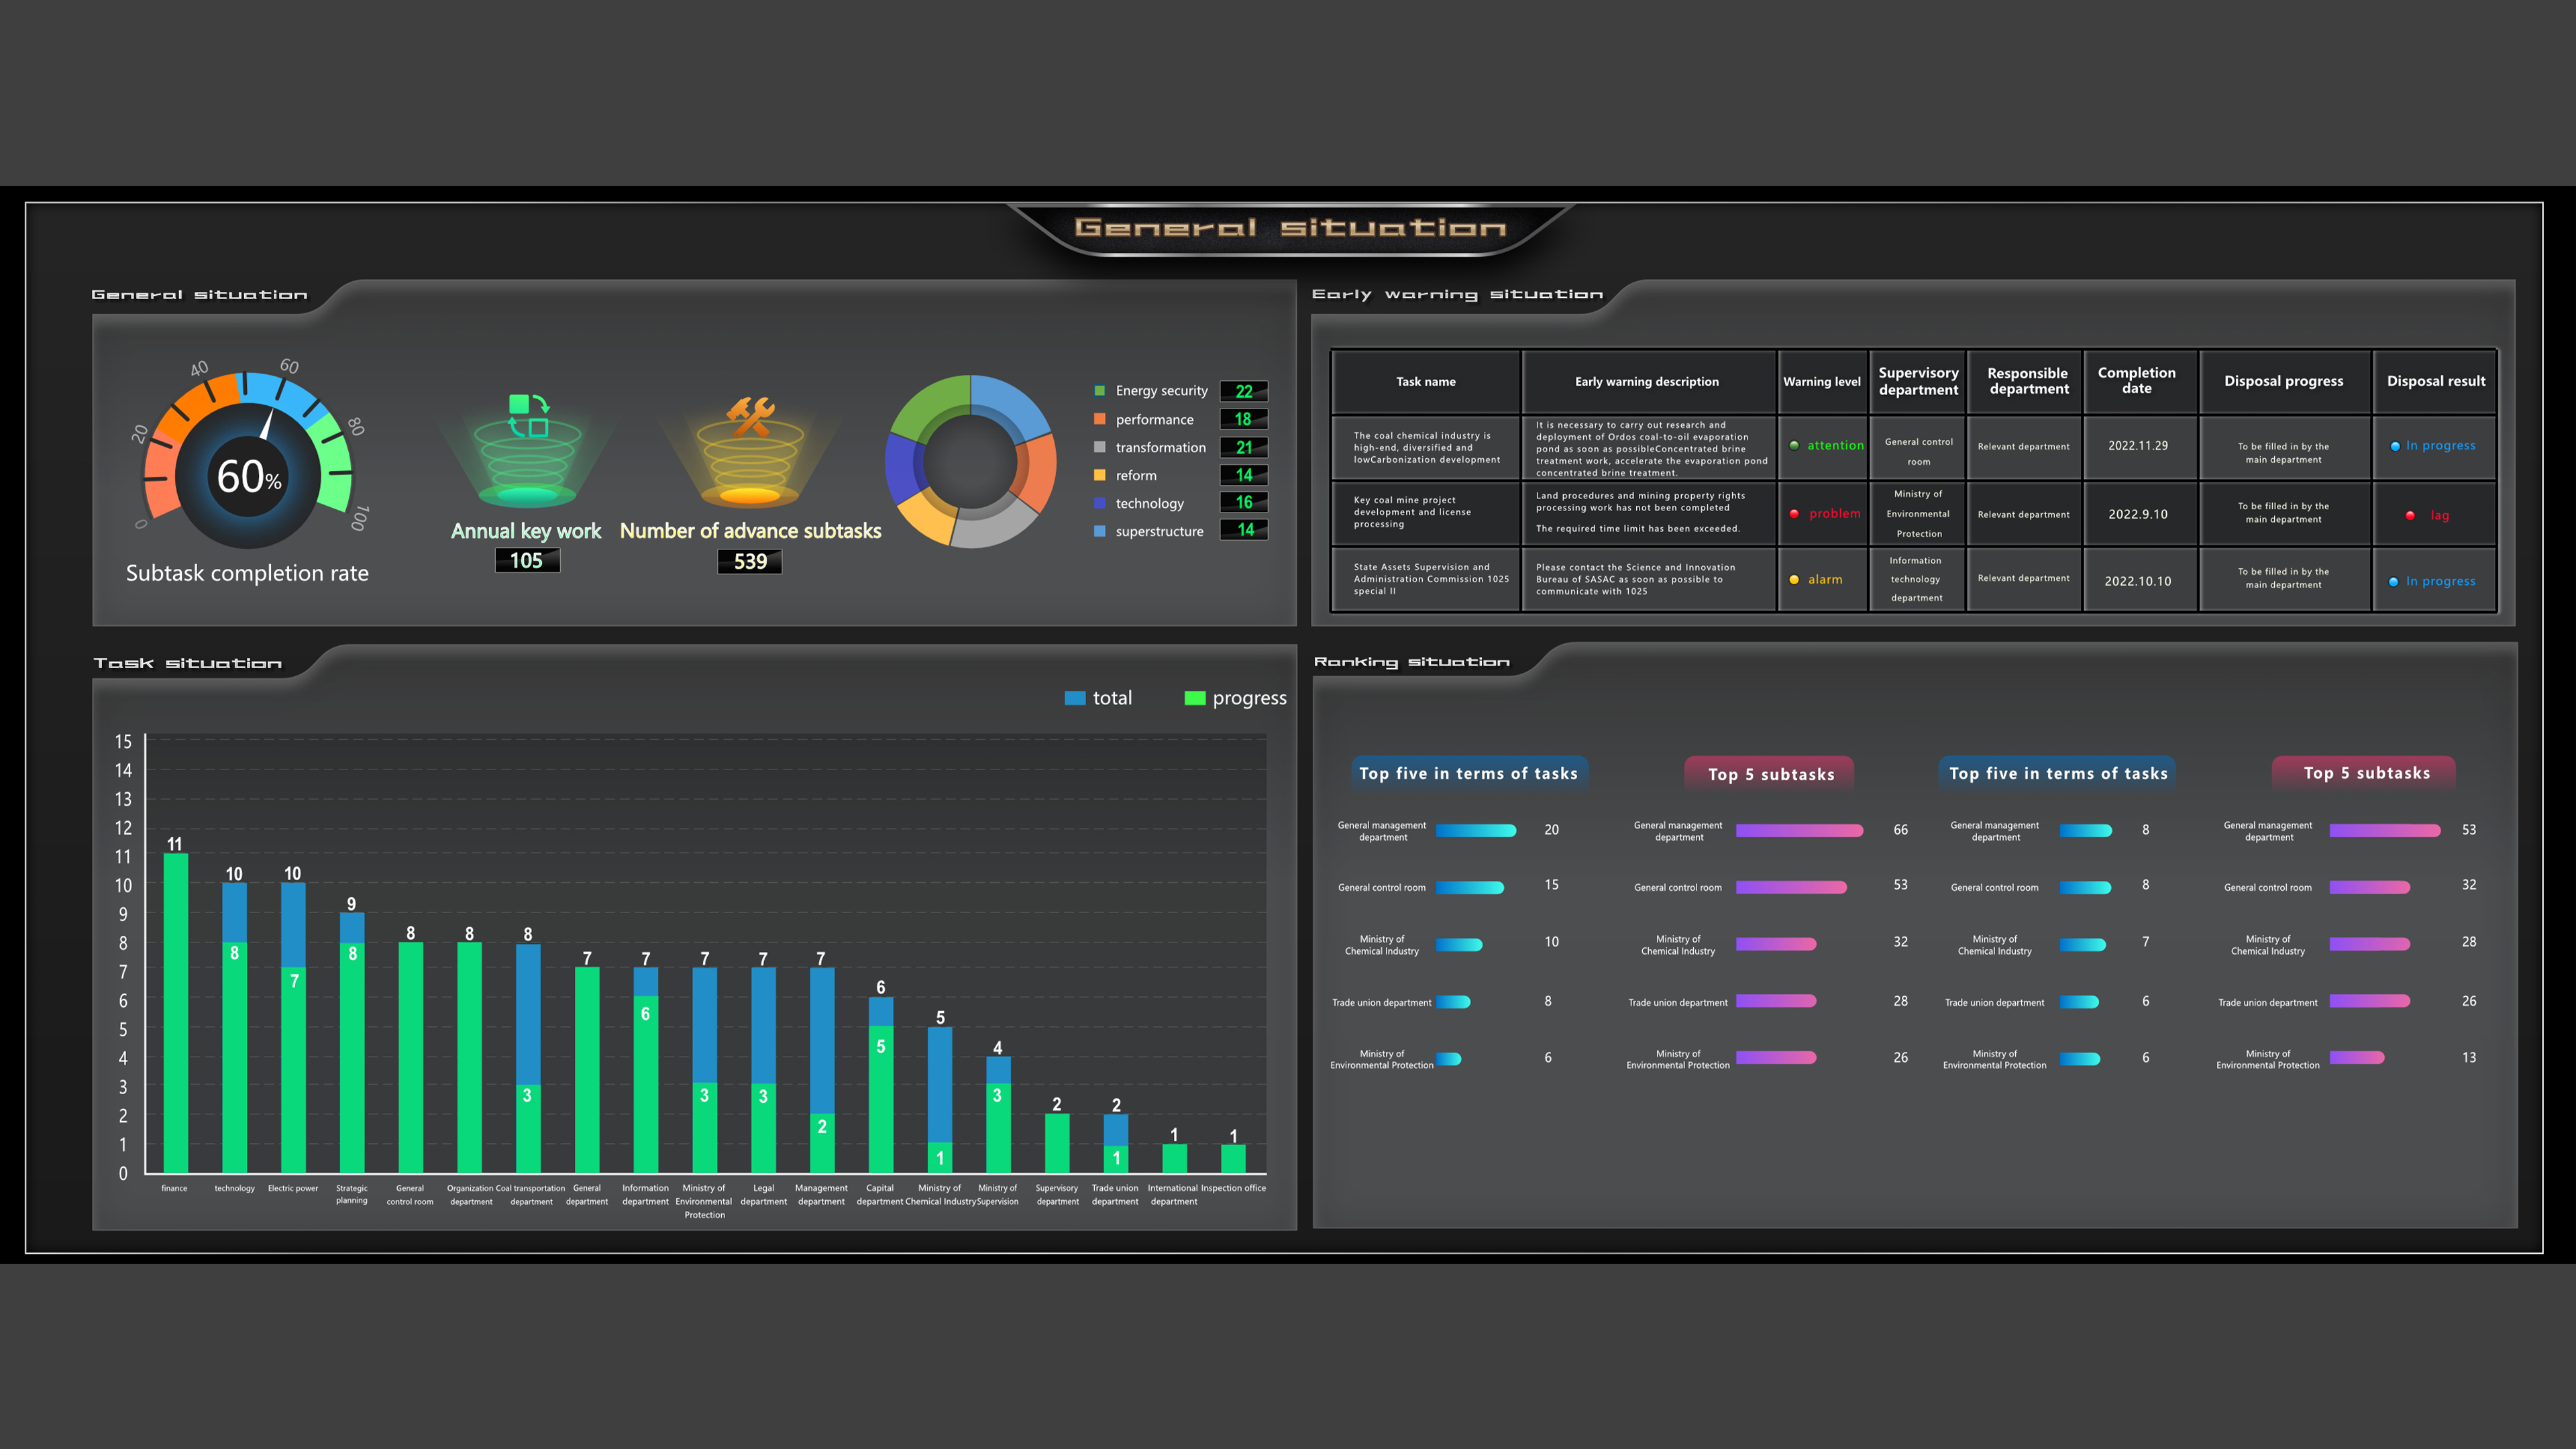
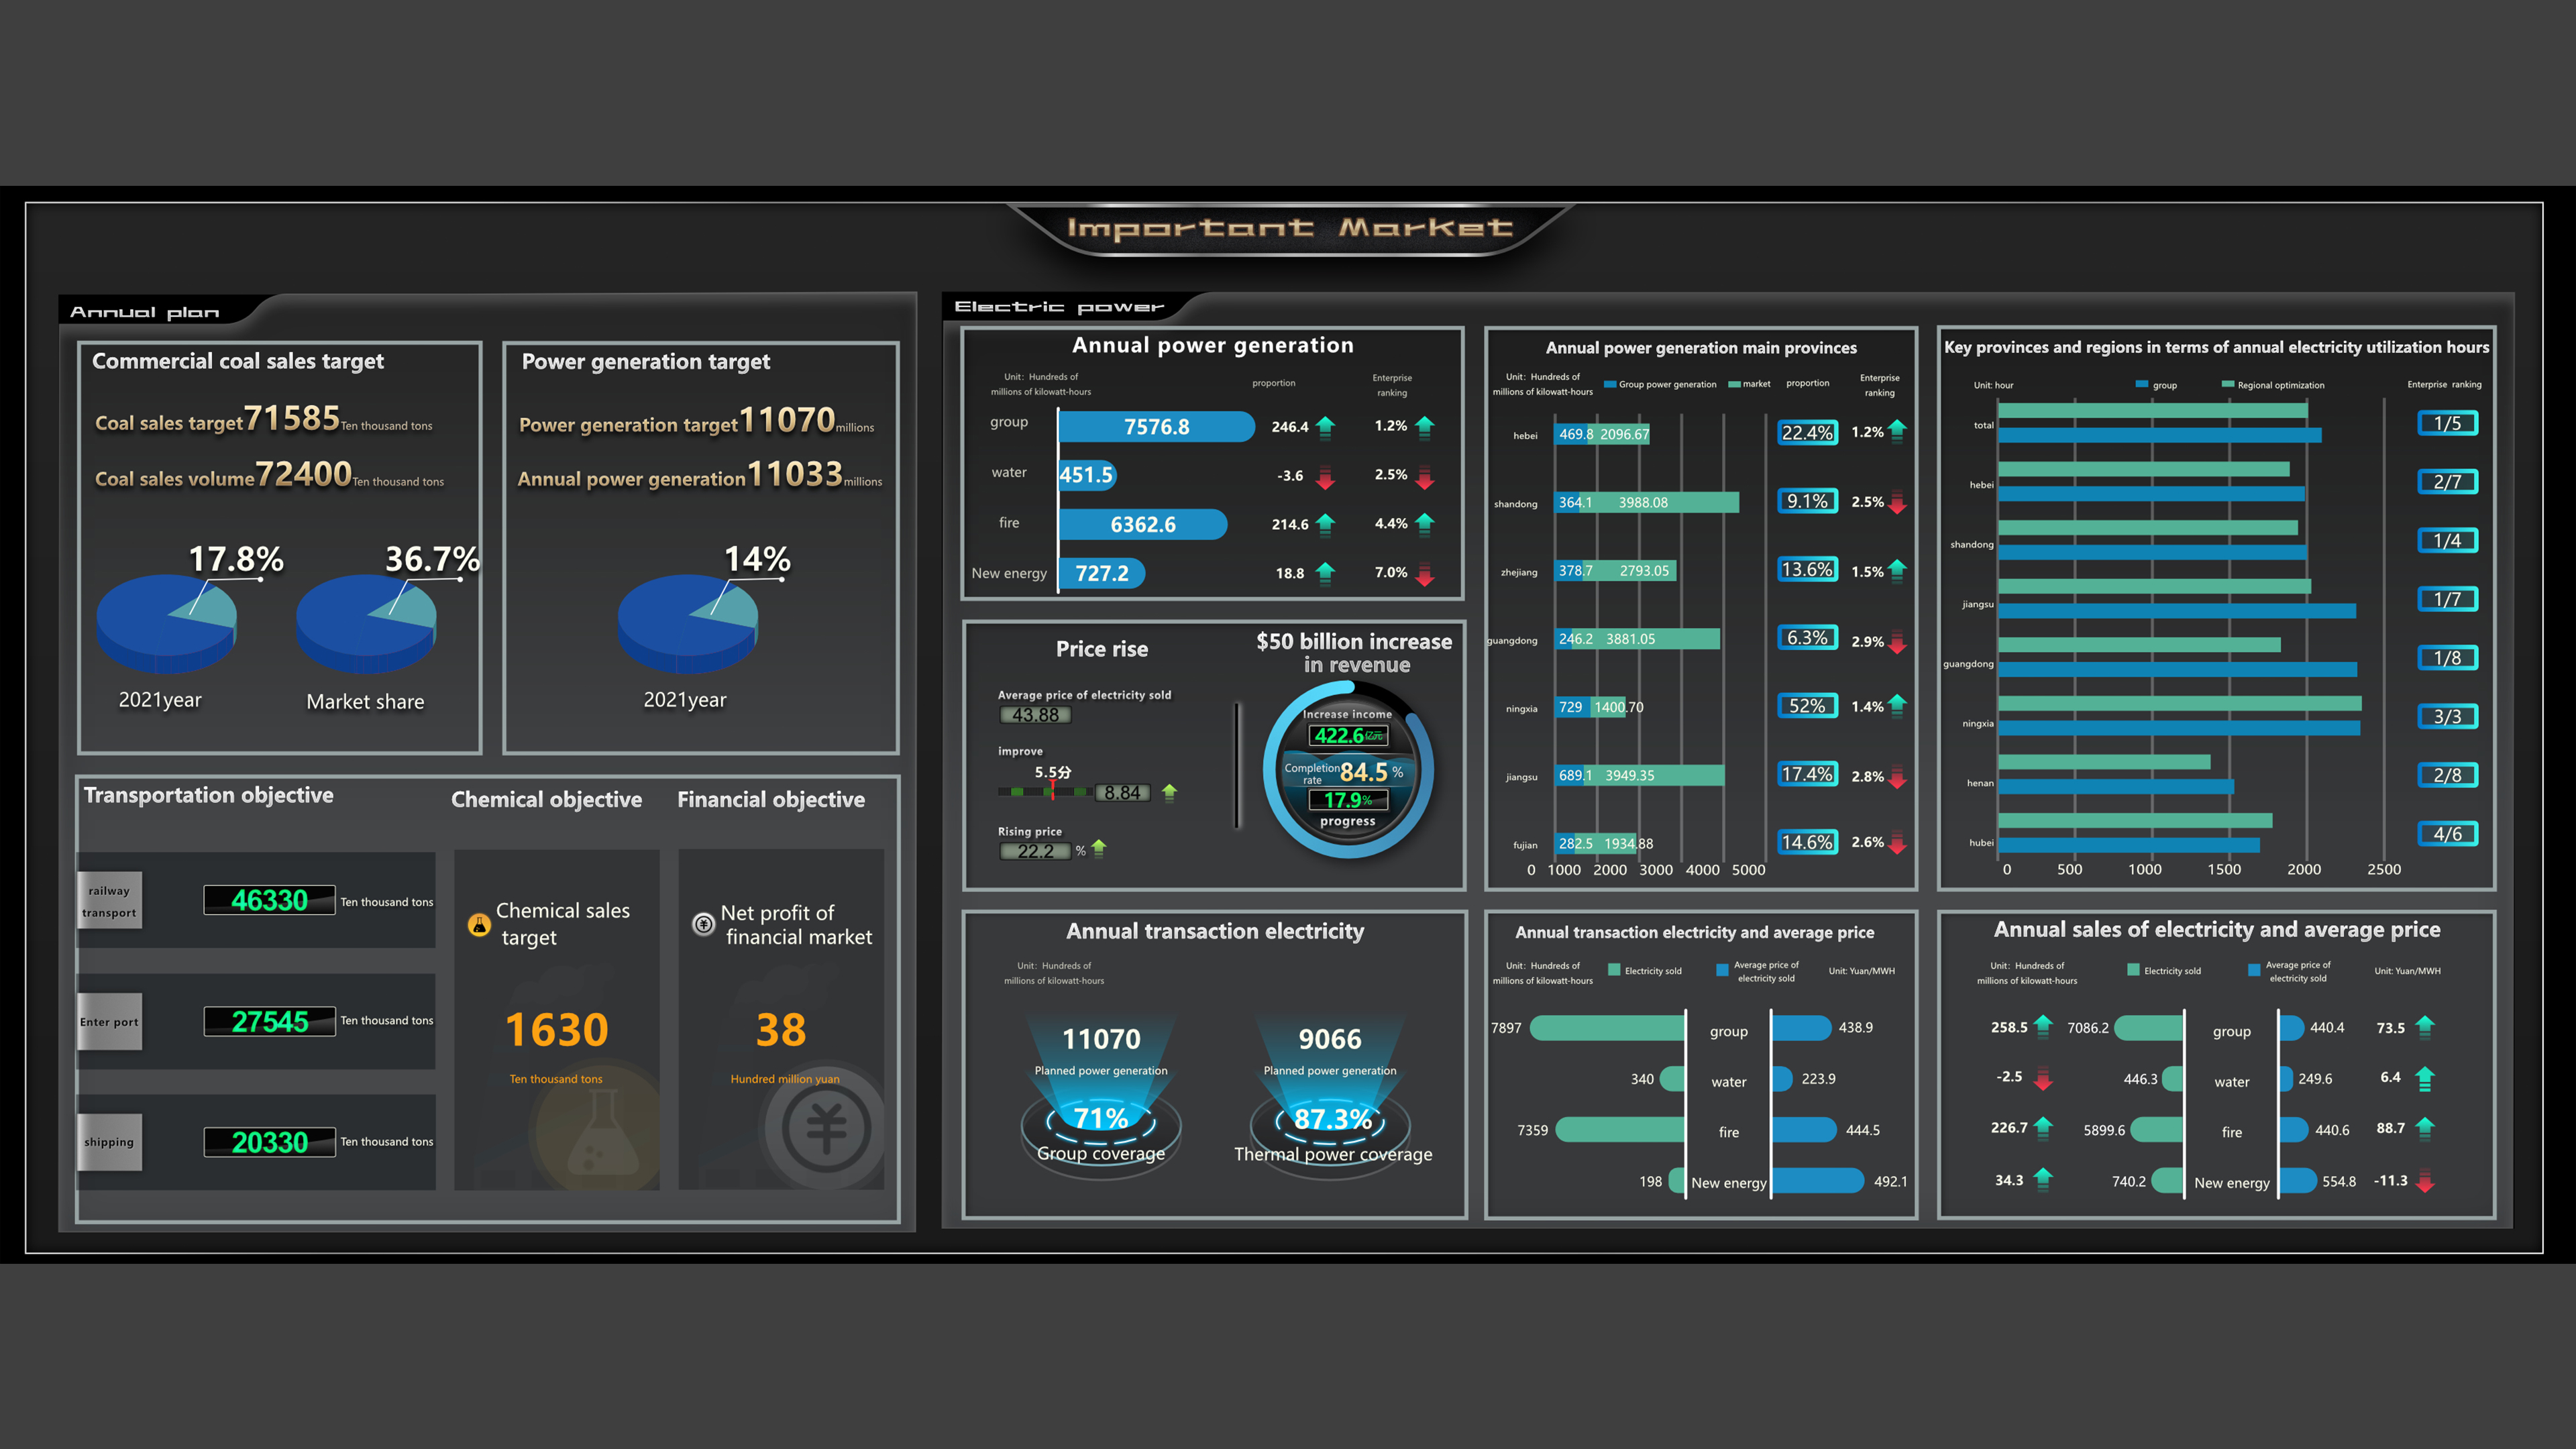
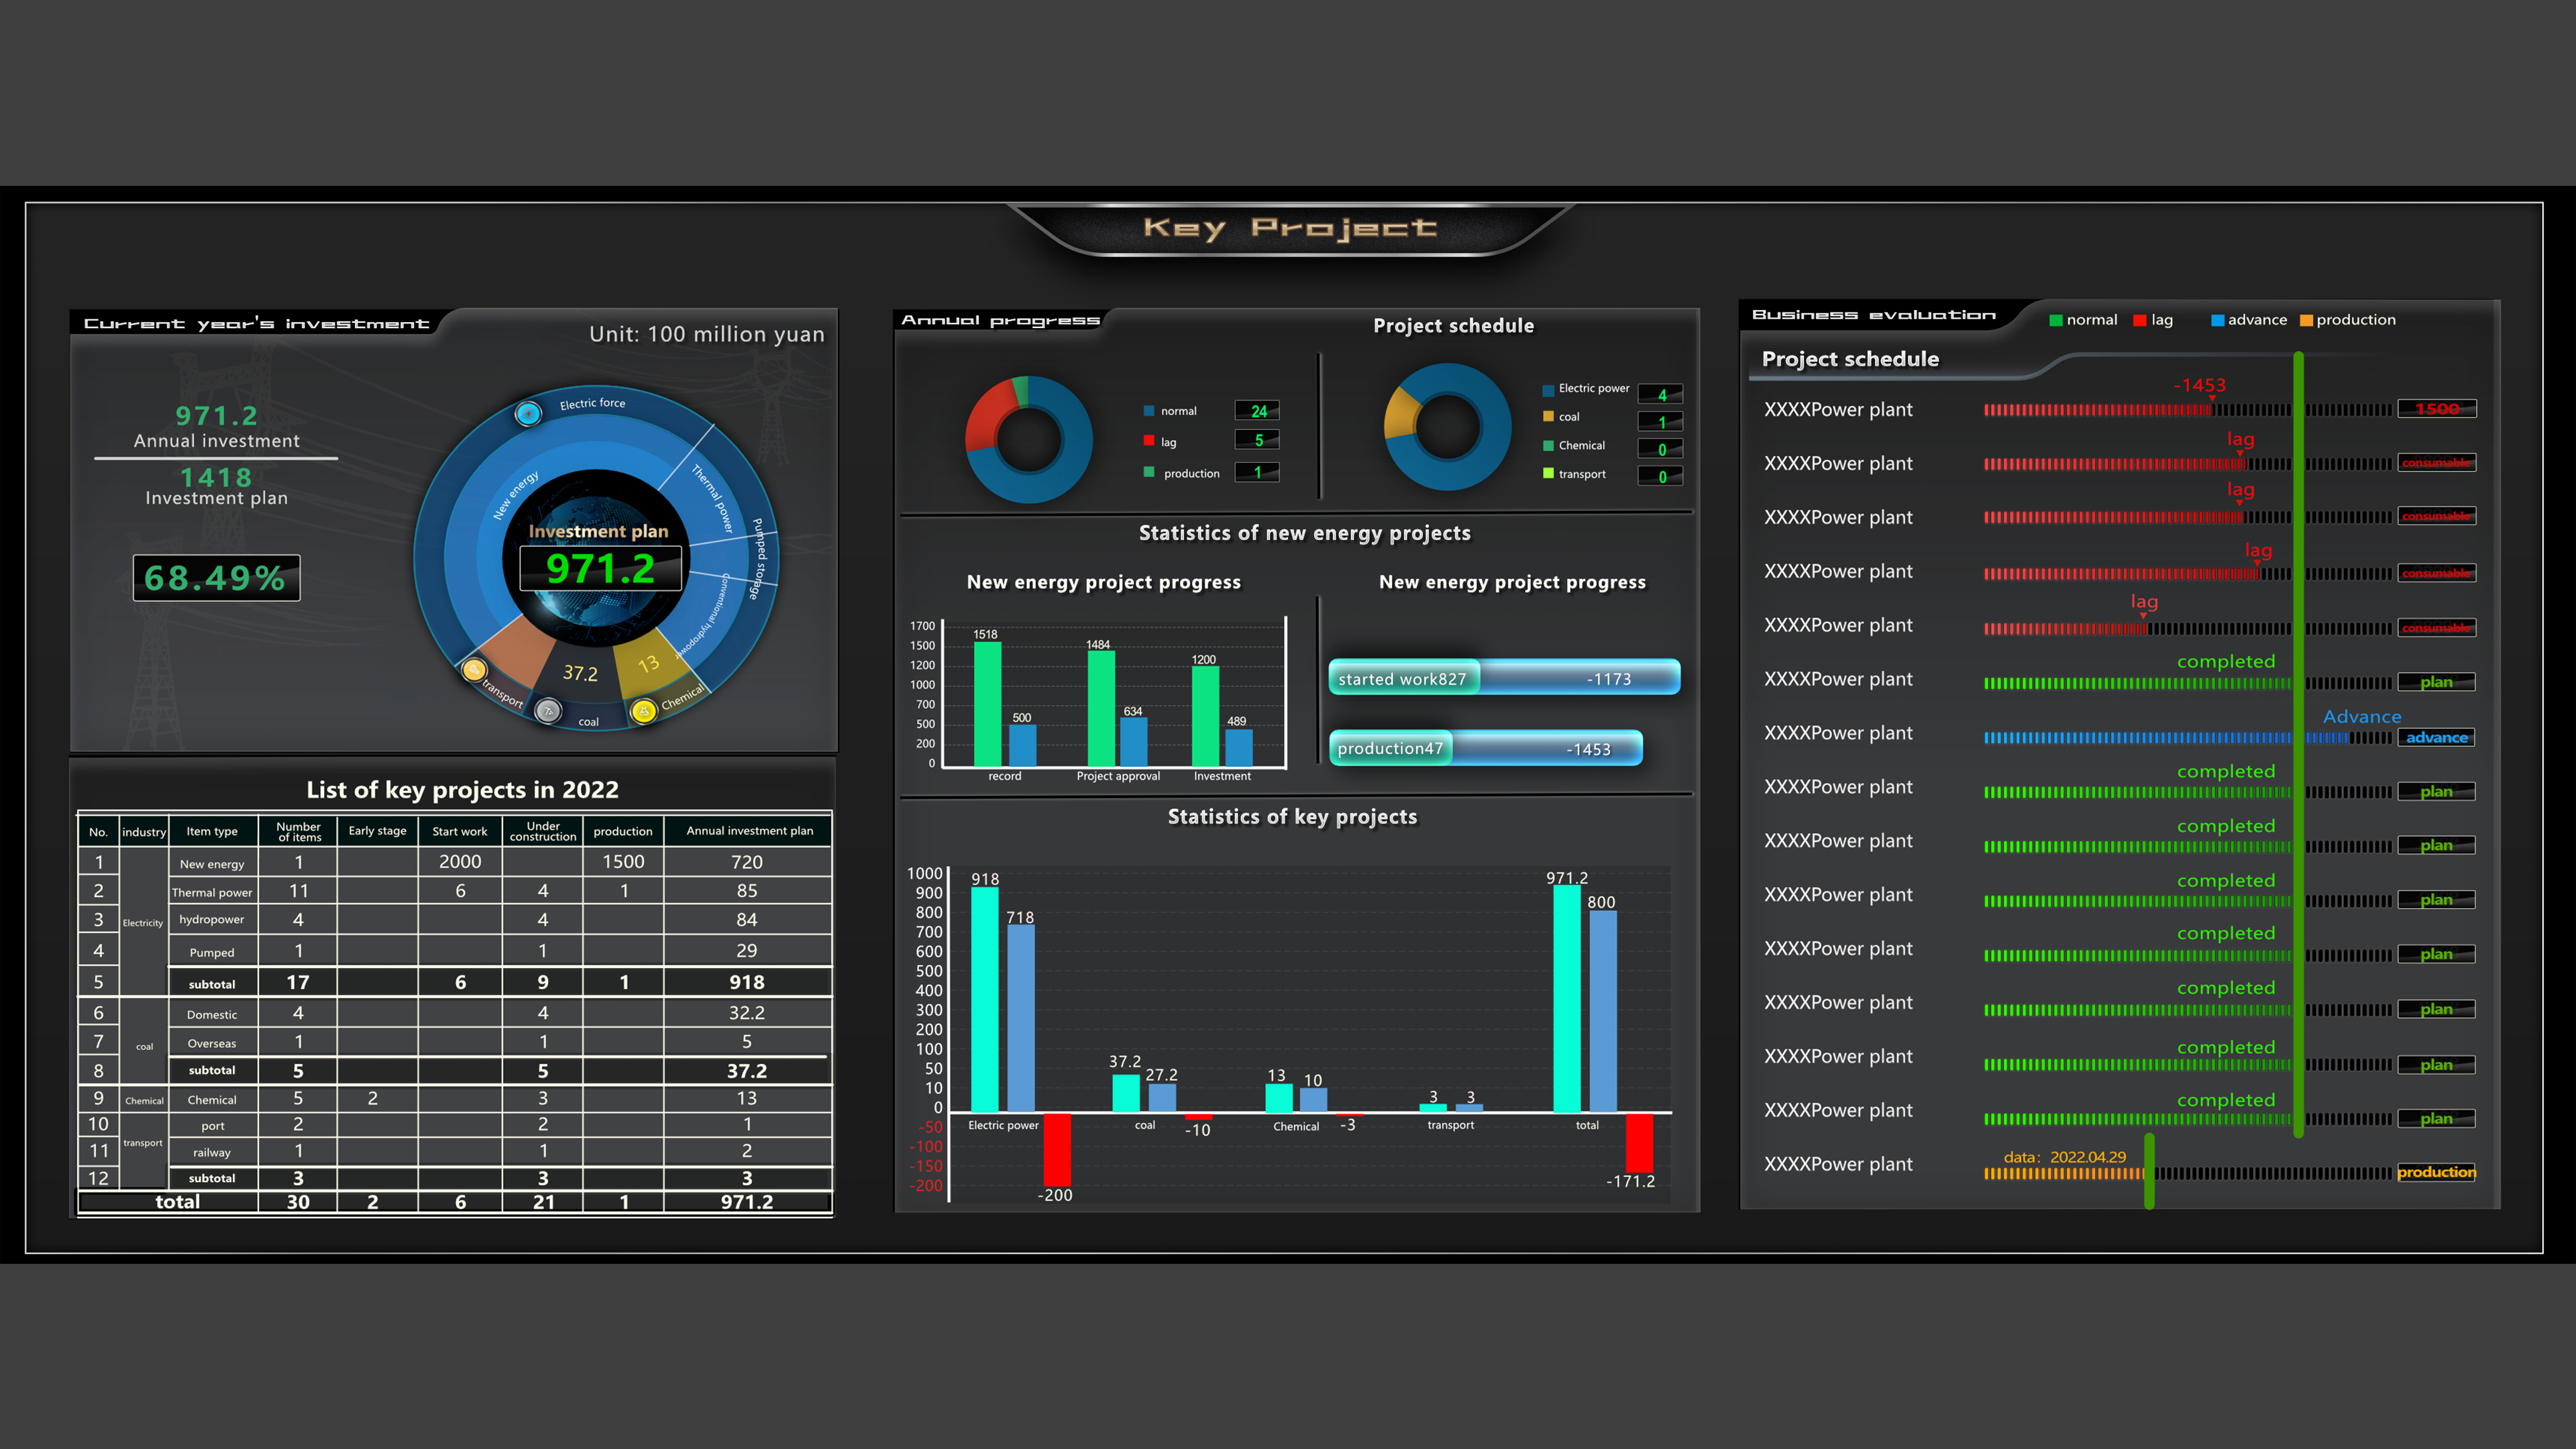
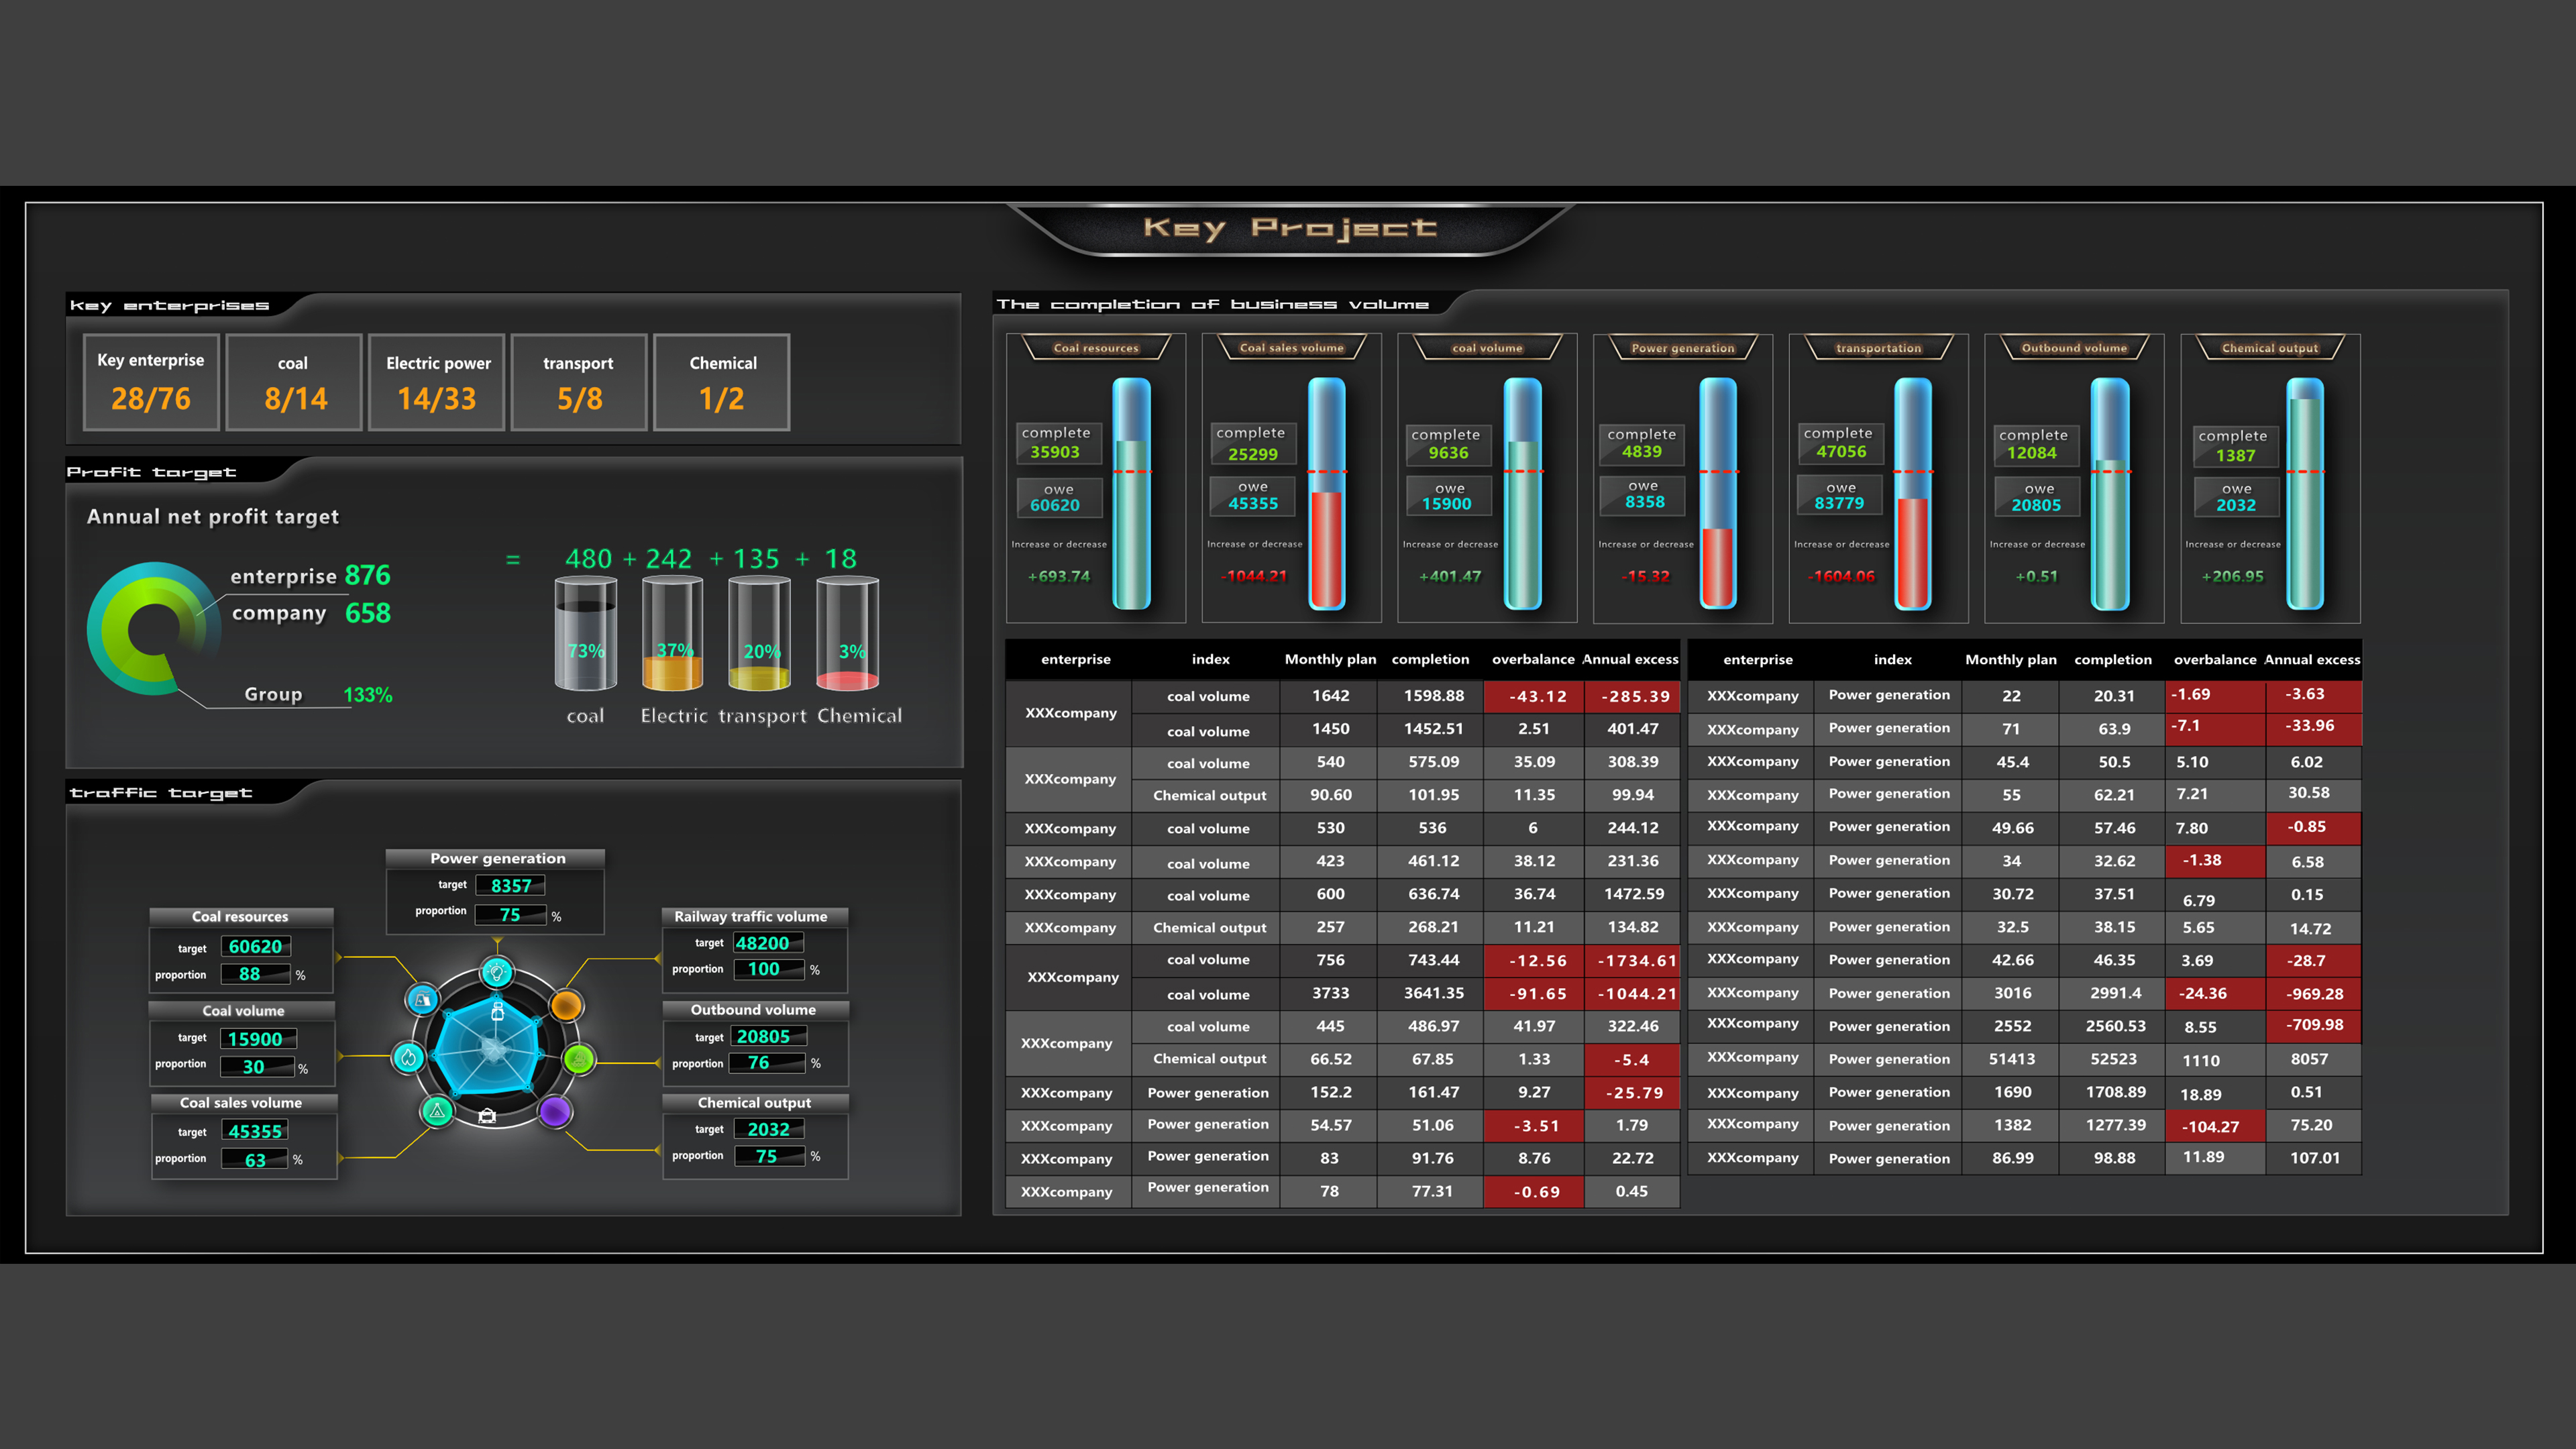
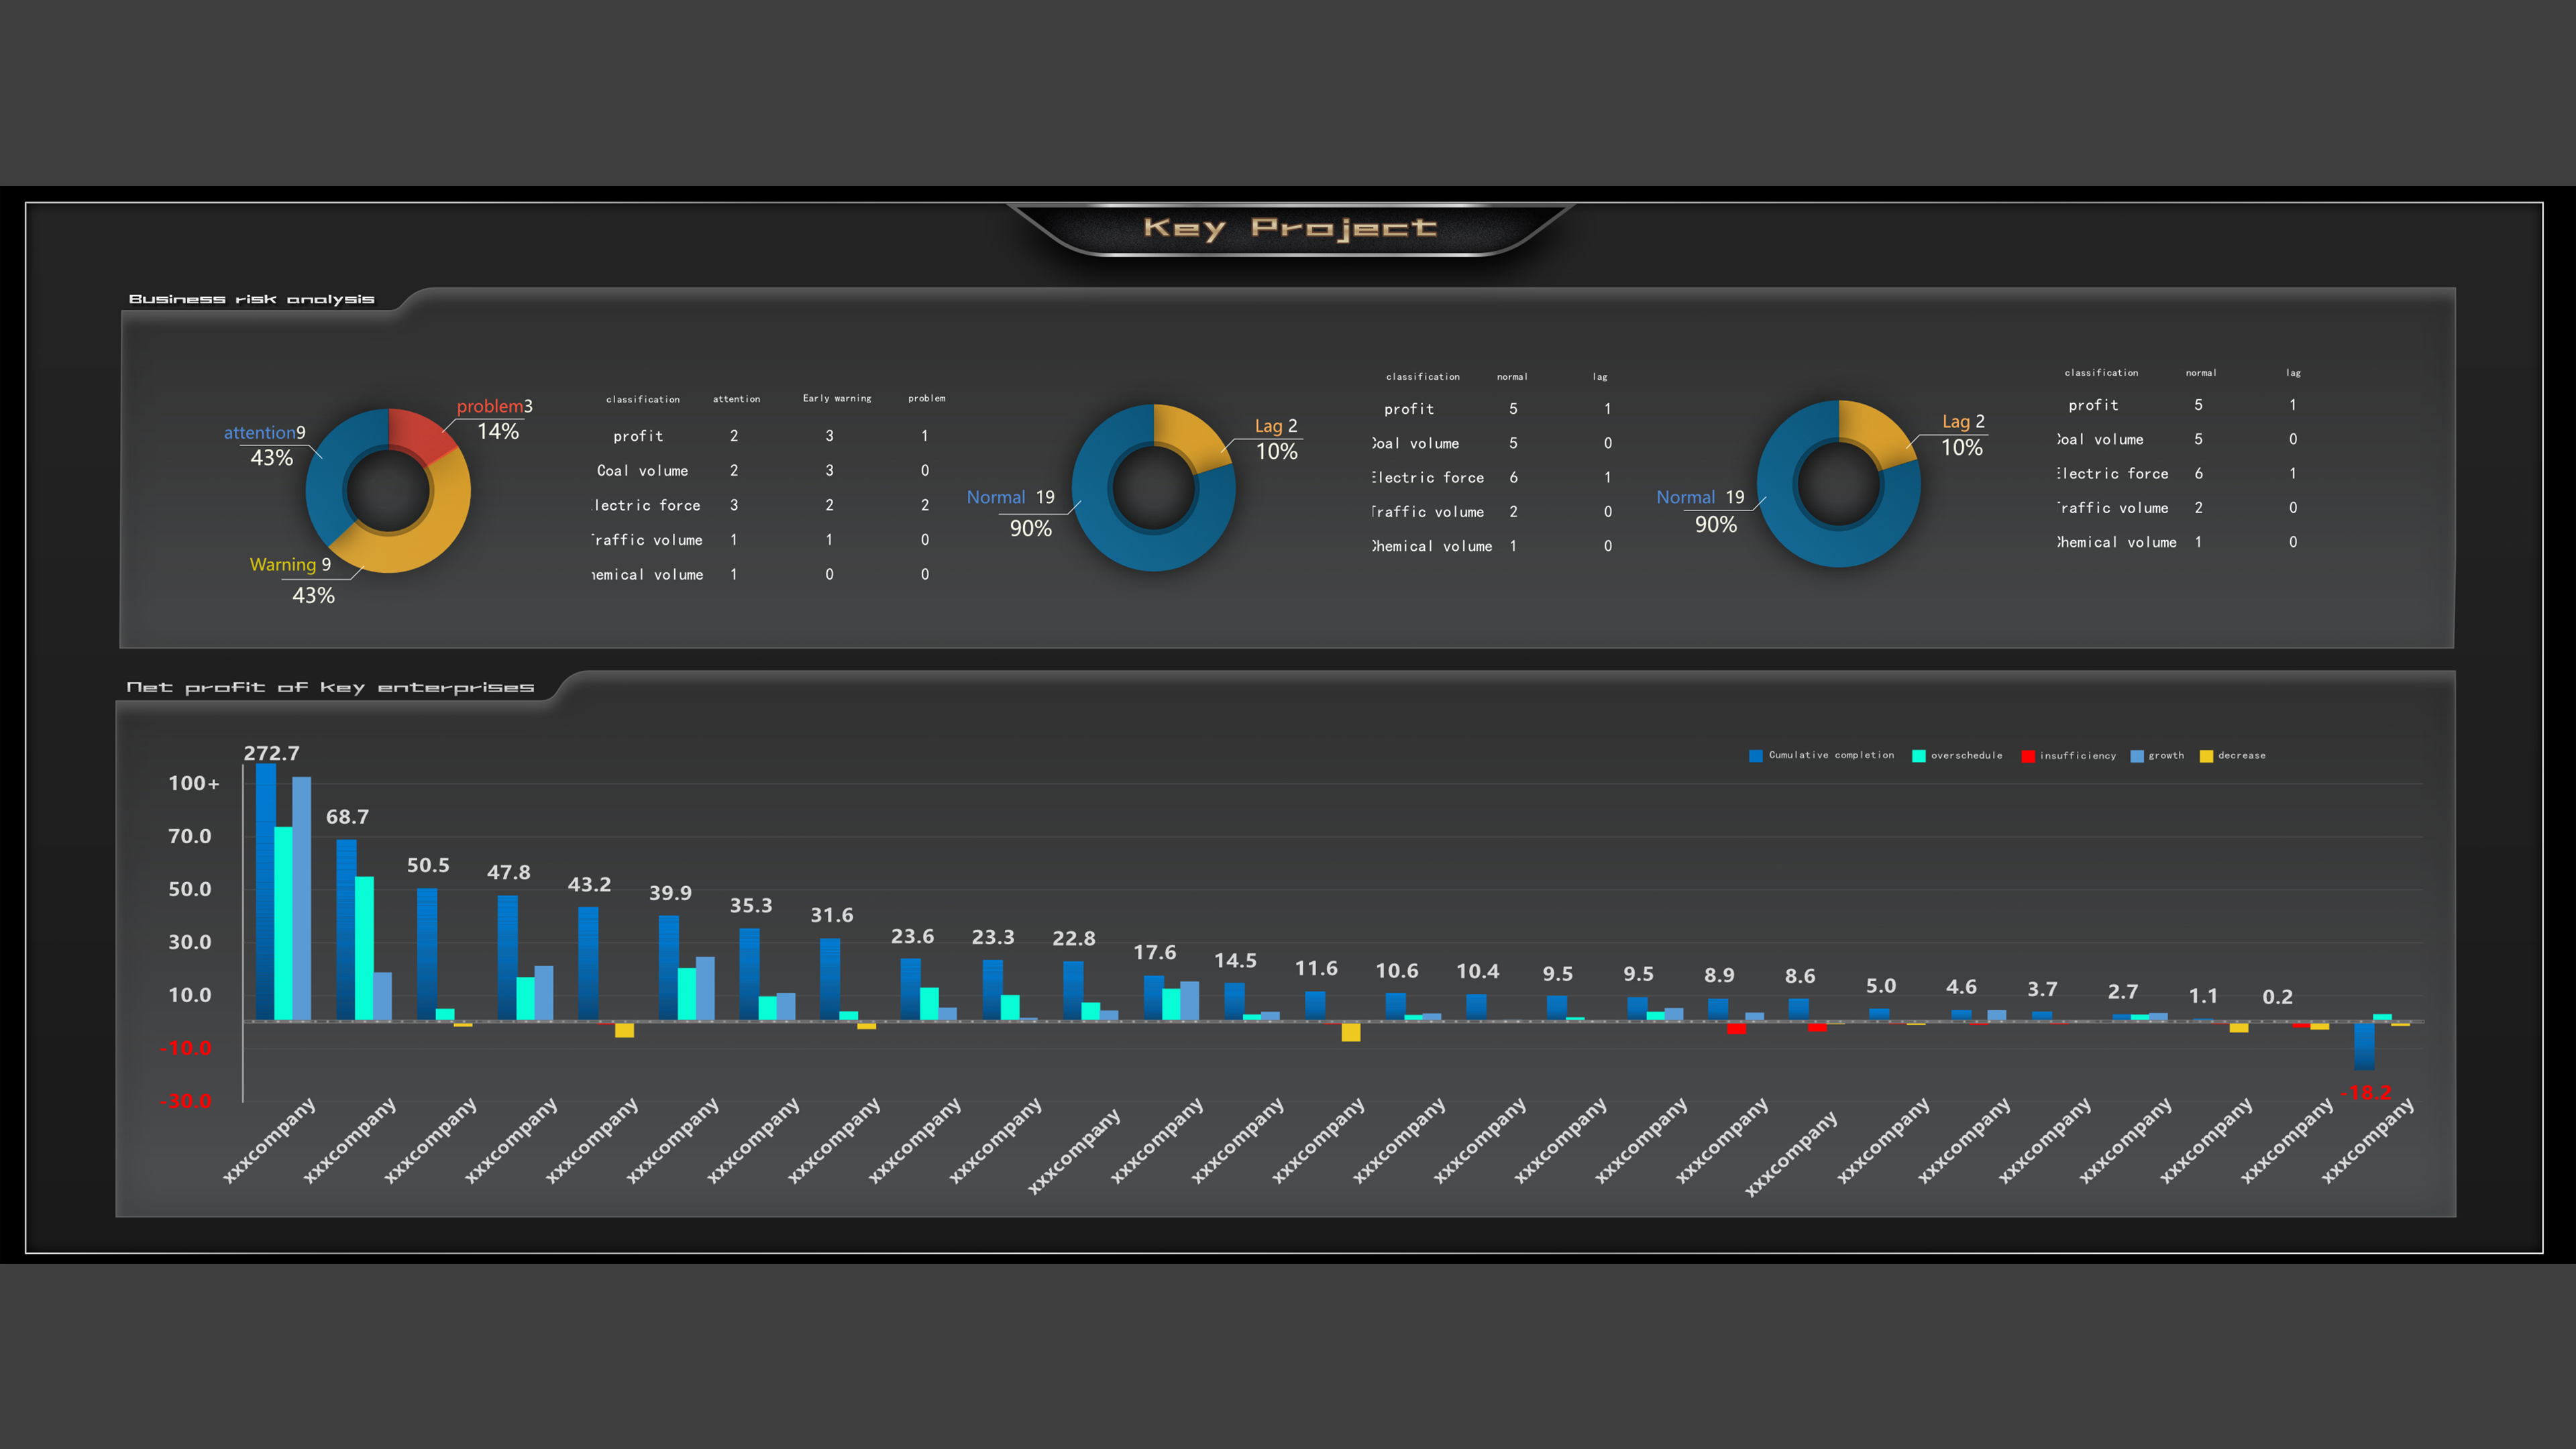
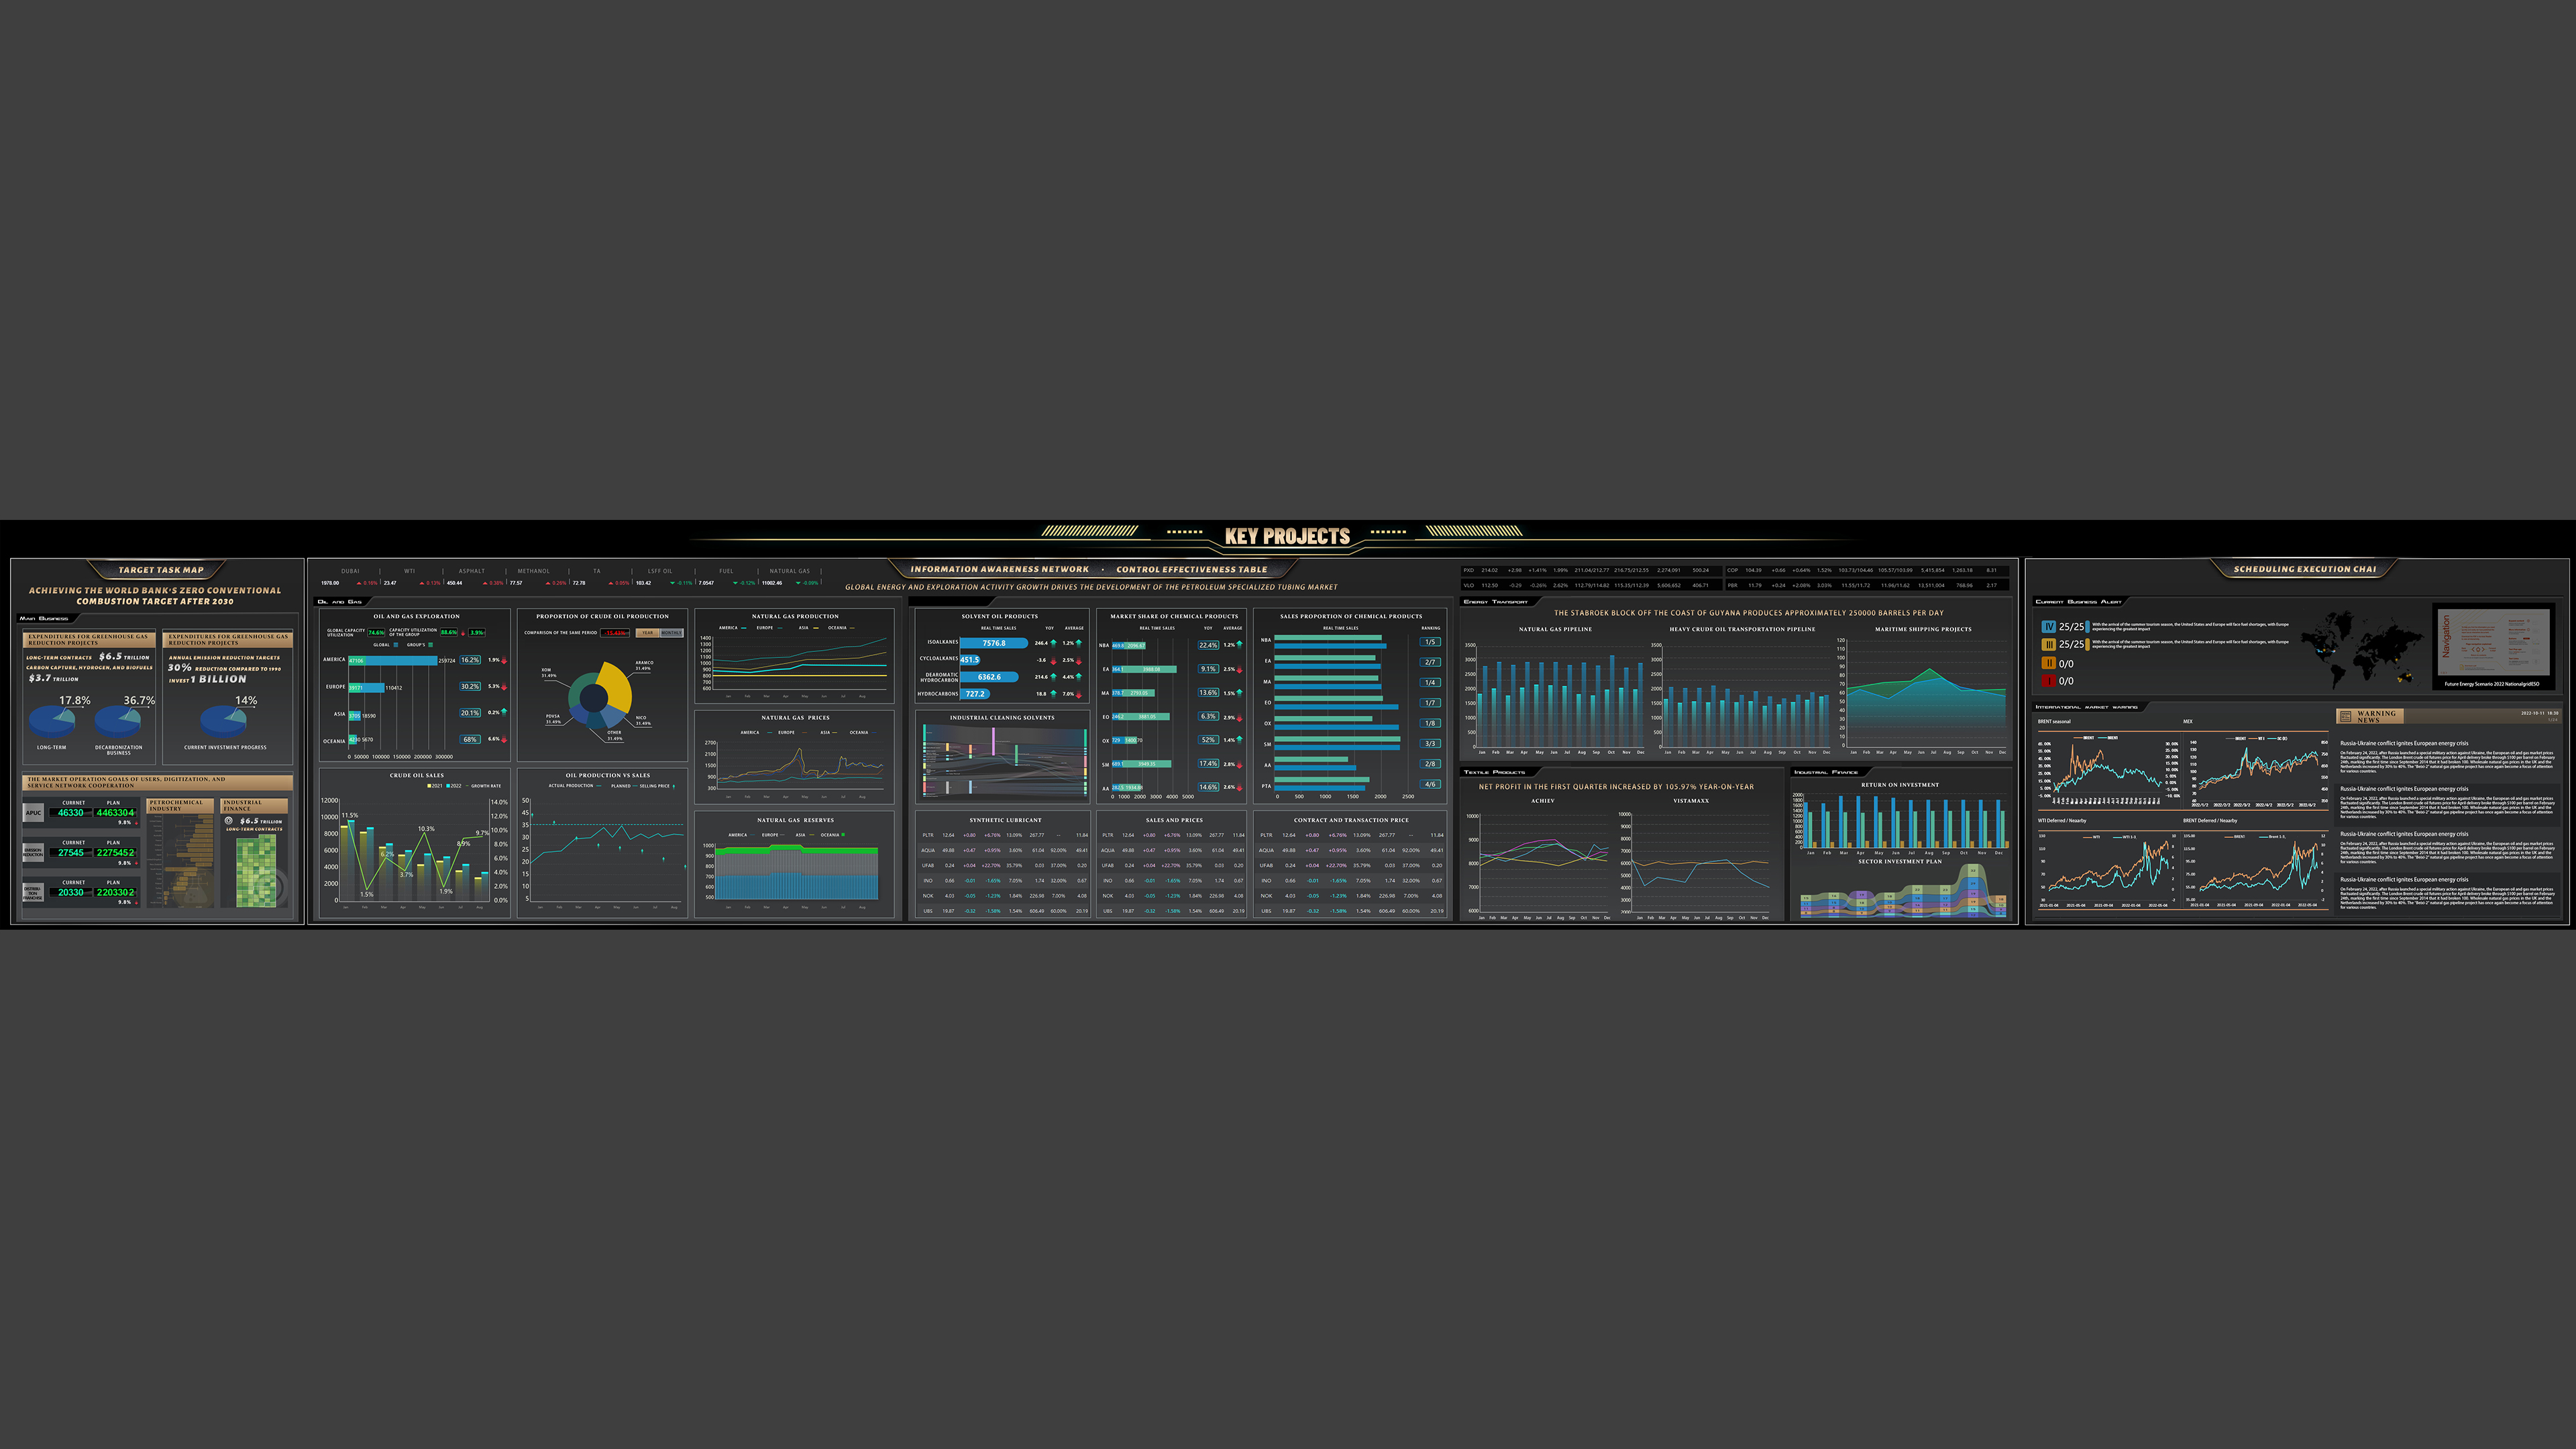
"Data Visualization Management Dashboard of Energy Industry Chain" is a data visualization management system designed for the energy sector. Based on data from energy supply conglomerates in unified dispatching and management, this system visually displays the data from various stages of the energy industry chain on a large screen. It summarizes the data performance in five aspects: target tasks, control effectiveness, information perception, scheduling execution, and assessment evaluation. This system helps energy enterprises or organizations monitor and manage the operation of the entire energy industry chain, thereby achieving sustainable development and management of the energy industry chain. The data visualization management dashboard utilizes visual representations to transform vast amounts of data into easily understandable and analyzable graphical displays. It features real-time data updates, interactive operations, multi-dimensional data visualization, as well as alerting and warning functionalities. Through visually impactful visuals, the system effectively communicates the value of the data to users, enabling them to quickly grasp business insights. Furthermore, it assists managers in uncovering relationships and patterns hidden within the data, providing a foundation for decision-making. With a focus on the energy production supply chain, this system can integrate various data from energy production, transmission, storage, consumption, and other stages. These data include, but are not limited to, energy supply, energy demand, energy prices, energy trading volume, energy losses, energy efficiency, and other key indicators. Through visualizing and presenting the data, managers can clearly understand the energy industry chain's relevant information. This enables them to achieve management innovation through emergency command, visualized scheduling, and multimedia-integrated dispatching. This system is built on James J. Gibson's

Entrant Company
Silversea Design
Category
Marketing & Promotional - Calendar
Country / Region
Taiwan

Entrant Company
Landslide Creative
Category
Website - Consulting
Country / Region
United States

Entrant Company
Hangzhou ICHdesign Cultural Creativity Co., Ltd
Category
Corporate Identity - Brand Identity
Country / Region
China

Entrant Company
Marsden Marketing
Category
Website - Business to Business
Country / Region
United States